
AUTOMATED TABLE & COLUMN PERFORMANCE SCORING
Snowflake makes scalability very easy to do. However, in certain cases adding more scale to a process is simply masking a deep underlying problem.
How do you know whether slow performance is the result of a poorly-sized warehouse vs poorly-loaded table or something else?
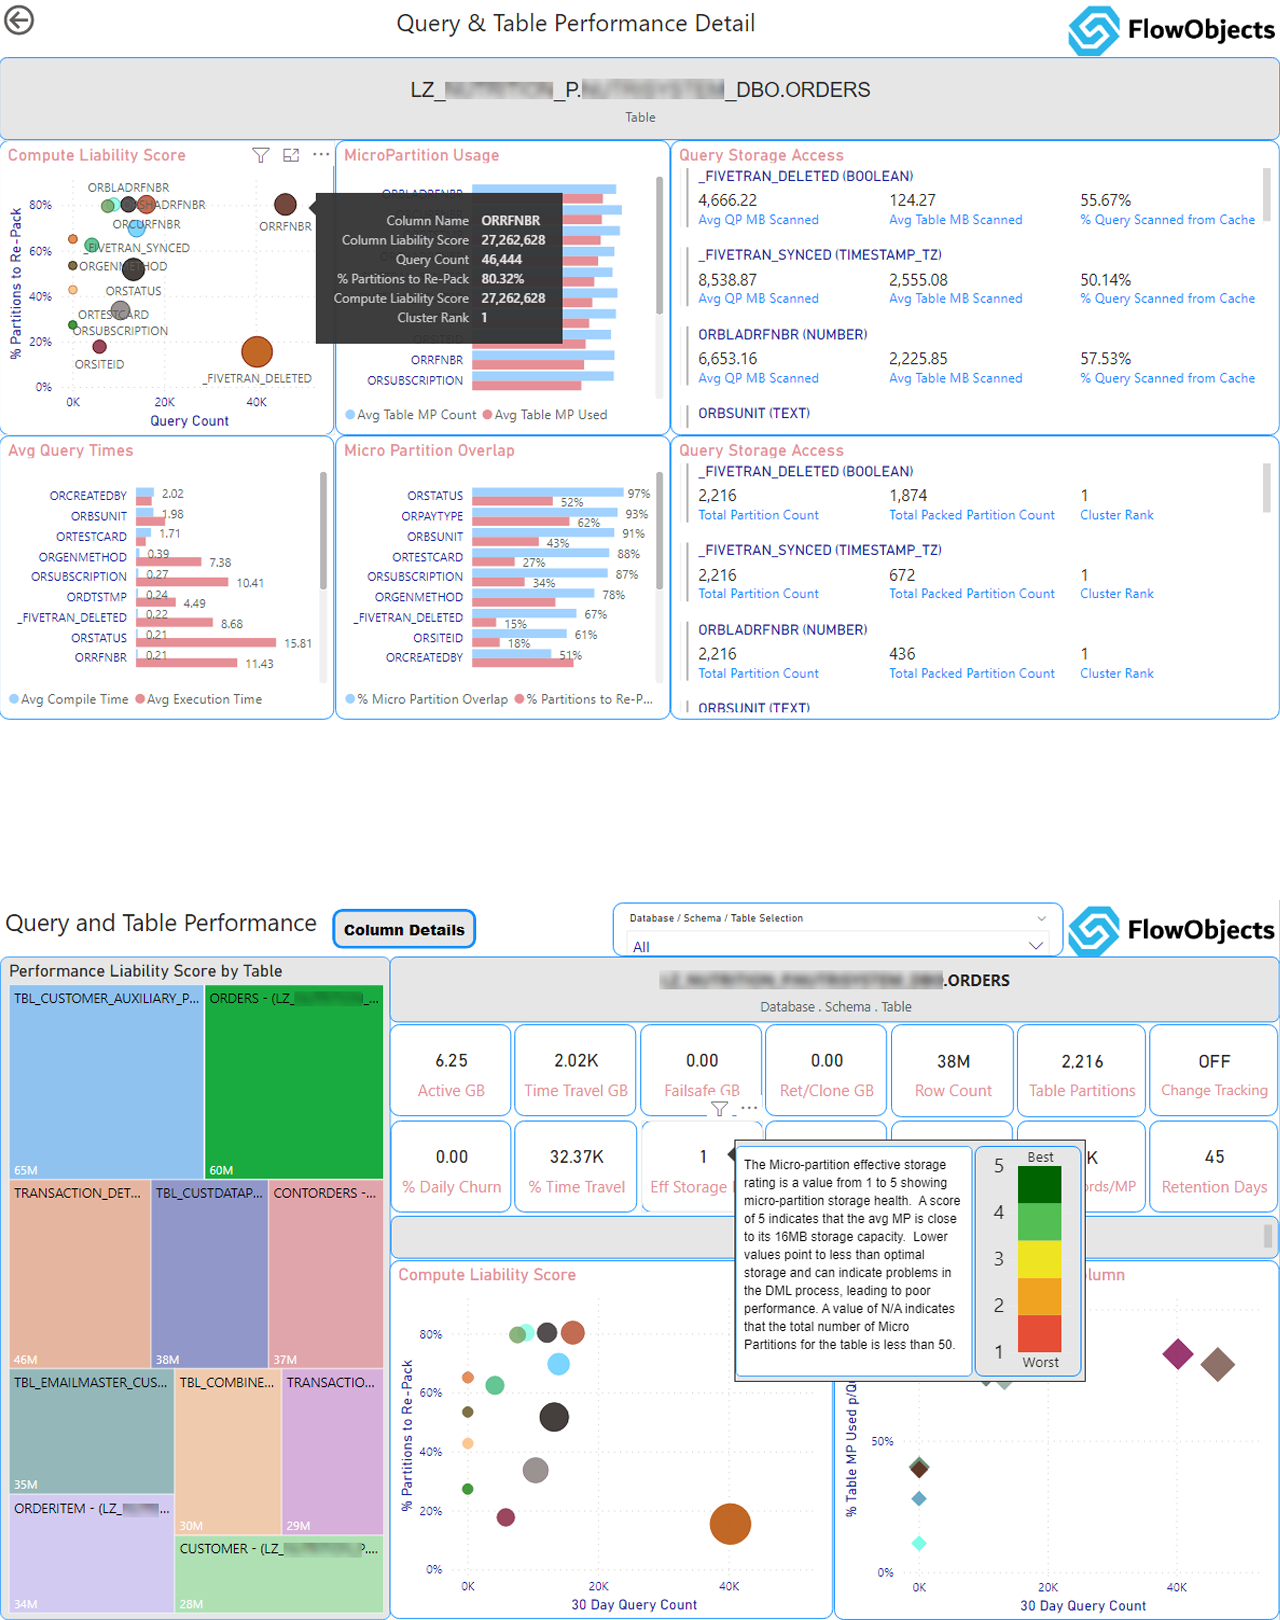
There are many reasons a table could be performing poorly. Snowflake does an excellent job of optimizing, but that doesn’t displace good data engineering practices. To get at the root of what causes poor performance, a VERY deep understanding of the Snowflake query processing must be mastered. This knowledge of Snowflake’s query optimizer, micro-partitions, metadata pointers, and query compiler was poured into a comprehensive performance analysis of the Snowflake by FlowObjects.
To conduct such performance metrics FlowObjects needs to persist the query plans in Snowflake which make it possible to run highly specific queries and produce critical metrics about performance. These performance metrics get centralized in a data visualization which can be sorted, filtered and interpreted.
To learn more about the data tables acquired by the FlowObjects solution click here.
OTHER USEFUL ANALYTICS
In addition to the Table and Column Performance Scoring, Intricity leverages the same scans to produce a visualization of the Snowflake environment. This visualization provides metrics in the following ways:
Credit Usage Accumulation & Breakdown
Track YTD Warehouse and SnowPipe credit accumulation month by month. Then see it broken down by the various warehouses in the deployment.

Monthly Warehouse Usage & Variance
See the delta between one month or another to validate the effectiveness of efficiency improvements or spikes in usage.
Storage Tracking
Monitor the average daily storage by month for storage, regular, stage, and failsafe.
Warehouse Usage by Day of Week & Time of Day
See the spikes and lulls in both your intra-week and intra-day credit consumption.
Single Run Stats
See where the most credits are being used in a single run and how many credits it consumes. This enables you to prioritize your scrutiny and optimizations.
AVG Queries VS Credits Used
Monitor the average number of queries vs the number of credits used in your deployment.
Detailed List of Warehouses
Get a list of all the warehouses, the current size, the min/max cluster count, the auto suspend settings, and other useful details about ownership.
Number of Jobs by Warehouse Daily
See which warehouses are running the most workloads.
Warehouse Credit Usage by Week & Time of Day
See which days of the week are consuming the most credits, and what times in the day represent the most/least consumption.
Query Count by Cluster
Quickly identify the queries that are consuming multiple clusters.

User Statistics & Default Role Counts
See how many active users you have and see where the distribution of those users roles live.

Month to Date Logins & Client Type Breakdown
See how many total logins you've had, failed logins, and the average logins by user. Also, see a ranked breakdown of clients being used.
User Details
Get a masked consolidated list of users that can provide details on locks, default rolls, and any default namespaces.
Query Counts & the Longest Running Command Types
See the total number of queries for a given time range and how many queries failed. Also, see the average execution time per query type.
Average Execution Time by User & Query Type
See the masked user names and their most common query types as well as the warehouse sizes and their average execution times.
Failed Query Details, & Month to Date Failed by User
Get a detailed breakdown of failed queries their error codes and what the query text was. Additionally, get a masked count of which users are submitting failed queries.
Selectable List of Existing Roles
Toggle roles on and off to see their relationships.

Identify the Inheritance
See which roles inherit from each other to ensure grants and revokes are done at the right level.

AUDIT RECOMMENDATIONS
With the study of the Snowflake landscape in hand, the Intricity team begins building a priority list of tasks for optimization.
These could include changes to the Access Control framework, how data is loaded, features that need to be turned on or off, optimizations that need to be made to columns and tables, data to information architecture, naming conventions, warehouse usage, and a host of other findings.
The findings are backed up by data uncovered from the FlowObjects scans which produced the persisted query plans and the dashboard.
The discovery will be outlined in a priority checklist and will be priced out if the tasks are to be conducted by Intricity. The organization is then empowered to take action on the priority list.
Additionally, should the organization decide to keep the FlowObjects assets after the Healthcheck, they are licensable from FlowObjects for a nominal yearly fee.
FlowObjects Auditing & Monitoring


WATCH A DEMO
![]()

TALK WITH A SPECIALIST
To discuss the health of your Snowflake environment, fill out the form below.