Written by Jared Hillam

I’m writing this whitepaper in the middle of the Coronavirus lockdown. Like many of you, I’ve made several attempts to buy toilet paper to no avail. Meanwhile, my friends have posted pictures of people forming a line (at 7:30 AM) wrapping around our local big-box retailer to get their hands on some. Who would have thought a humble roll of toilet paper would hold the public's attention like this...
With this situation in the background, I was listening in on a call with one of our Data Architects. The client was describing the frustration they had gathering requirements from their end users. Every time the question was asked, “What data do you need?”, the immediate answer was, “Give me all of it.” The concern that data consumers have is not without real-world pain and experiences. Often when an organization has an over-the-wall relationship between IT and Business, we see data hoarding. From IT’s view, the business users don’t understand how to make the data landscape scale, and from the end user’s perspective, IT doesn’t know what the data means. Both parties are right!
The downstream impacts are tribal behavior, where the end-users see IT as a barrier to getting what they want. So whenever end users are asked, “What do you need”? The following statement goes through their head. “If I tell them exactly what analysis I need to do, they’ll take so long trying to build something that by the time they’re done I’ll have moved on to another need.” So the request is made by the end users “Just give me everything”, which drives the data hoarding psychology. The psychological definition of hoarding from the Merriam-Webster dictionary is:
the compulsion to continually accumulate a variety of items that are often considered useless or worthless by others accompanied by an inability to discard the items without great distress.
Fortunately, data hoarding doesn’t usually go as deep as some psychological disorder. However, there are those that fear losing their job because “this is what I do”. However, what they may not see is how the massive waste of time and duplicated effort could turn into truly productive activity and make them 10X more valuable to the organization. There are a number of factors that make this difficult to see past which gets in the way of making progress to break the “give me everything” logjam. Say users get access to a fully replicated copy of the source application database. I think we could apply the old 80/20 rule to the columns of data with 80% being almost useless to end users, and the latter 20% being useful. End users might look at that prediction and assume I’m being facetious. I’m not. Application databases are designed to literally run the application functions. Flags, triggers, stored procedure events, and a bevy of other little data levers that drive the application processes are what make up the remaining 80% of the application data columns. They simply aren’t designed to help you make decisions, this is the reason that application vendors end up developing an API (Application Programming Interface), so this web of complexity can be summarized into more meaningful access points. Say you do give 100% of the data to the analyst community to comb out the 20%. Here are a few points that need to be considered:
- The logic for how data comes together will get embedded into individual data analyst reports and dashboards.
- This will create multiple versions of the truth because there is no common data model, which will put executives in a logjam for making decisions.
- This will also mean that users will end up duplicating efforts for how data comes together. For example, the method of tracking dates and times will be replicated for almost every analysis.
So how does an organization reestablish the cultural trust between the two parties? What’s the path? To start, give the business what it wants. Give them the data. I know, I know, I just spent 667 words telling you what a big waste of time that would be. But that’s just the very first step. Consider this, there probably isn’t a great relationship between the data analyst community and the IT organization (at least in the scenarios I’ve outlined). So we start the process of mending that relationship between IT and the Analyst community by conducting an executive-endorsed strategic meeting to outline what the next phases of analytical adoption look like. Analysts will be delighted to hear about getting access to the data they want, and we’ll call that access point our Data Lake. But from there, we’re going to take the organization on a journey that everybody must agree on. That journey is one of gradual logical conformity. In other words, the data analyst community has to agree on sharing the logic for data conformity which today is being embedded into their analytics. This is critical for standardizing logic for the broader organization. This is a nexus point where management needs to be on board. Whatever the consequence, this must be agreed on by the business and its analyst community.
So how do organizations provide the data for the Lake? Do we just grab EVERYTHING? Well let’s be at least a little sane about this process. Like I mentioned earlier, there’s a whole lot of nothing stored in application databases, but we certainly want to get the stuff that is relevant. To meet in the middle, here’s the rule to follow. If a user asks for a column of data in a table, take the whole table into the Data Lake. This ensures that any further requests for information are VERY likely covered in the first pass. Organizations are welcome to grab everything, but consider that this move isn’t “free”. There is a cost to storing, streaming, computing, and getting distracted by all that data that you will never query. Also keep in mind that since the Data Lake stores the most atomic version of the data, there’s no structural consequence for asking for more later.
To drive the next stage of conformity, we build some accelerators into the Data Lake for the data analyst community. This starts by building some cross references in the Data Lake to assist analysts in assembling across data sources. We also start doing some high-level master conformity of the data. This will address some of the duplication we see between source systems around customer and entity identity.
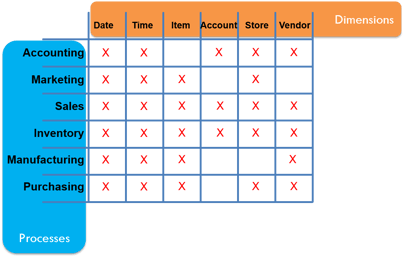
The next step is to move toward shared logic in a Data Warehouse. This is where the complex conformity logic can be persisted to feed the broad data analyst community. This is when business leaders need to engage in the process. This is done by participating in facilitated team sessions to identify where the organization’s need for information crosses process owners. For example, the Manufacturing team and the Sales team may have many similar data points (dimensions) they’re interested in (date/time, item, and vendor). This validation of the required dimensions will need to get done for all the process owners. What this will do is start putting everybody on the same page.
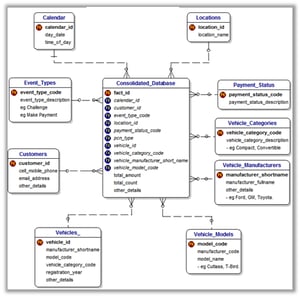
The resulting content will be something like the image above, which we call a Bus Matrix. With this in place, we can start getting a picture of what shared logic might look like. To formalize that further, a high-level conceptual data model is designed. This isn’t the final data model but rather just a first draft. The final version will have gone through multiple validation iterations with the business. Out of all the things you want to be sure you’re working with your business users on it’s the Data Model. These early meetings are a super critical moment. It’s not the most expensive moment (although the consultants you’re working with will likely have the highest rates) but it’s the most mission-critical. The vetting of this data model will help you get the most value out of shared, cross-functional logic. Additionally, it will be the secret sauce that will allow your analytics to really scale.
The next step in the process is to conduct data transformation. This is the step that will start transforming the raw application data into something that a broad user community can leverage. Now, THIS is the most expensive process. However, there are some shortcuts. First let me describe what we’re doing. The data in the application database sits in a form (as we mentioned earlier) that is designed to service the application. This literally means that the logical structure of the database is NOT conducive to running analytics. We need to take the data out of that form and land it into the data model that I mentioned just a paragraph ago. (The landing of the data into this layer provides a massive productivity gain to the business. Not only will the varied attributes be standardized, but the queries themselves will run MUCH faster. Not to mention that the amount of code required to even get the data you want will be reduced drastically.) To do that, there is quite a bit of transformation logic that has to be written. The complexity of that logic can be very high, so thus the number of people on a project like this is also higher than the strategy. Here is where we take a shortcut. See in the old days, we used to have to write a mapping for each piece of data to the target platform. This meant that I would take a data integration tool and hand map/code each data feed into the target database.
Today, no more. We have a bot do all the coding for us, and we just feed the bot the right patterns to code for. The code generator allows us to decide what integration tool or database we want for our runtime, and we export to that format. Along with that exported code, we also generate the documentation and data lineage.
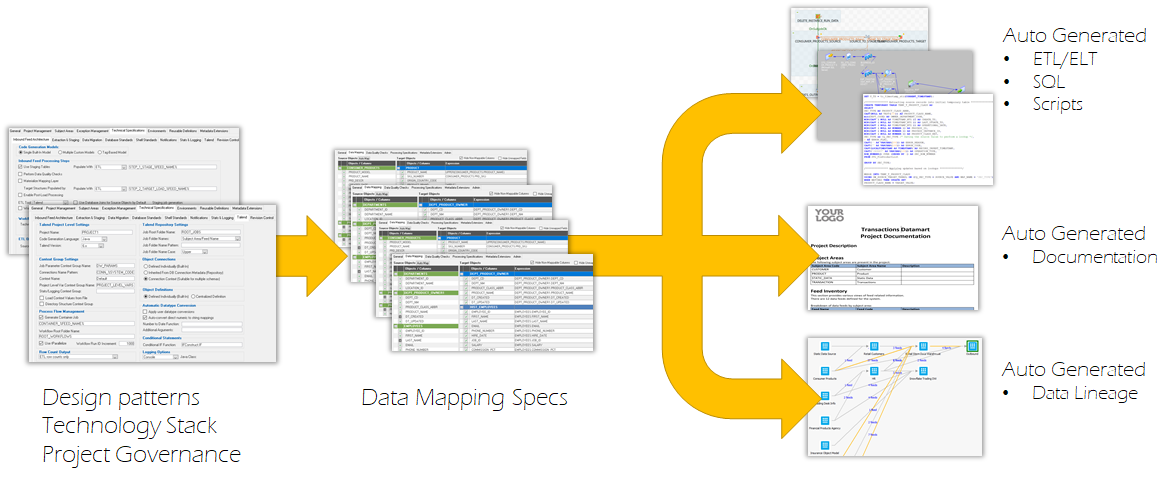
This drastically reduces the level of effort without locking you into a runtime tool. Don’t get me wrong, there’s still work here, but we can do it at least 4X faster by using a code generator to run the process.
With the Data Warehouse in place, the standards for how attributes relate to each other can be persisted. For example, how Customer relates to a Date, and how those relate to an Order can be formalized and reused with trust. This also means that the data analyst community can really get deeper, faster, better insights because their time isn’t being wasted in arduous data munging tasks.
So in the end, how does this address the data hoarding issue?
- The Data Lake is providing all the atomic data in a single location, so analysts don’t have to build their own sandboxes for doing data experiments
- Productionizing a data experiment is possible via the Data Warehouse
- The logic for data integration isn’t locked into individual analysts analytical tools or worse in their heads
- Data elements get reused because they’re constantly being refreshed with new data through an automated integration framework
- The agreed location for trusted data is established so analysts stop getting tribal about their version of the truth

Much like the logistical crunch of the toilet paper supply chain during the Coronavirus outbreak, ultimately the system will adapt to the change in demand. The order around the chaos will ultimately iron out the wrinkles which drive the public to hoard something they don’t need. The same is true with data. Your data systems can be engineered to get the business what it needs and to avoid information shortages.
Who is Intricity?
Intricity is a specialized selection of over 100 Data Management Professionals, with offices located across the USA and Headquarters in New York City. Our team of experts has implemented in a variety of Industries including, Healthcare, Insurance, Manufacturing, Financial Services, Media, Pharmaceutical, Retail, and others. Intricity is uniquely positioned as a partner to the business that deeply understands what makes the data tick. This joint knowledge and acumen has positioned Intricity to beat out its Big 4 competitors time and time again. Intricity’s area of expertise spans the entirety of the information lifecycle. This means when you’re problem involves data; Intricity will be a trusted partner. Intricity's services cover a broad range of data-to-information engineering needs:
What Makes Intricity Different?
While Intricity conducts highly intricate and complex data management projects, Intricity is first a foremost a Business User Centric consulting company. Our internal slogan is to Simplify Complexity. This means that we take complex data management challenges and not only make them understandable to the business but also make them easier to operate. Intricity does this through using tools and techniques that are familiar to business people but adapted for IT content.
Thought Leadership
Intricity authors a highly sought after Data Management Video Series targeted towards Business Stakeholders at https://www.intricity.com/videos. These videos are used in universities across the world. Here is a small set of universities leveraging Intricity’s videos as a teaching tool:

Talk With a Specialist
If you would like to talk with an Intricity Specialist about your particular scenario, don’t hesitate to reach out to us. You can write us an email: specialist@intricity.com
(C) 2023 by Intricity, LLC
This content is the sole property of Intricity LLC. No reproduction can be made without Intricity's explicit consent.
Intricity, LLC. 244 Fifth Avenue Suite 2026 New York, NY 10001
Phone: 212.461.1100 • Fax: 212.461.1110 • Website: www.intricity.com