Written by Jared Hillam
The Board

There’s an unforgettable scene in the movie A Beautiful Mind when the wife discovers her husband's conspiracy room. He, being a pattern genius and a schizophrenic, had assembled a vast conspiracy board with endless connections to grand plans from enemies far and wide.
While the example in A Beautiful Mind showed its downsides, connecting the dots between different data points can be a powerful way of representing the world. This used to be something limited to newspaper clippings and yarn, but today we get to benefit from the scalability of computation. Specifically, this is the realm of graph databases.
Graph Database
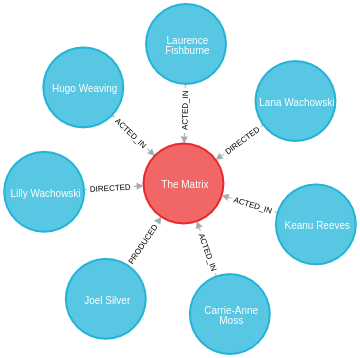
In a graph database, you usually see it represented as a set of nouns and verbs. The nodes are typically a person, place, or thing, and the relationship that connects the nodes typically represents the verbs. My goal in using nouns and verbs is to simplify the concept so it’s not an exact parallel. So let’s go through an example:
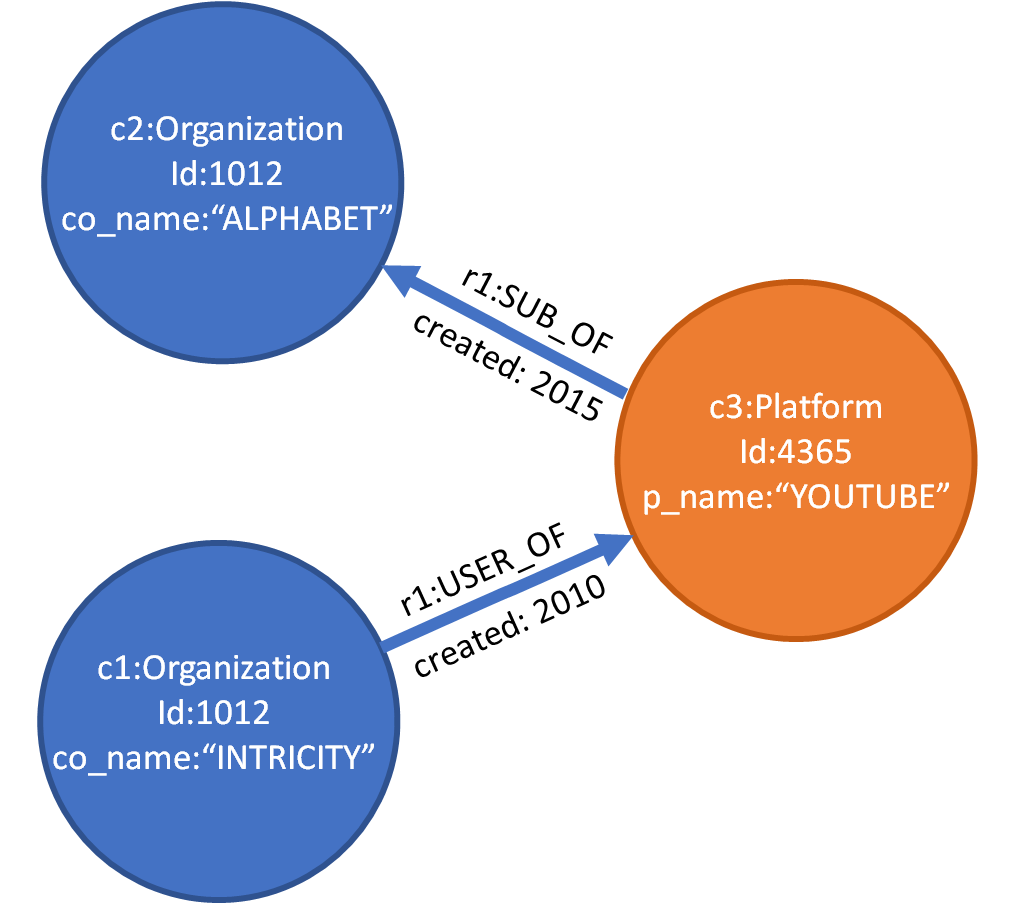
In this graph, we show how INTRICITY is related to Alphabet (Google’s parent). You can see that “INTRICITY” connects to “ALPHABET” via “YOUTUBE”. INTRICITY is a user of YouTube and Alphabet owns YouTube. The circles represent the people, places, and things; the arrows represent the direction of the described relationship.
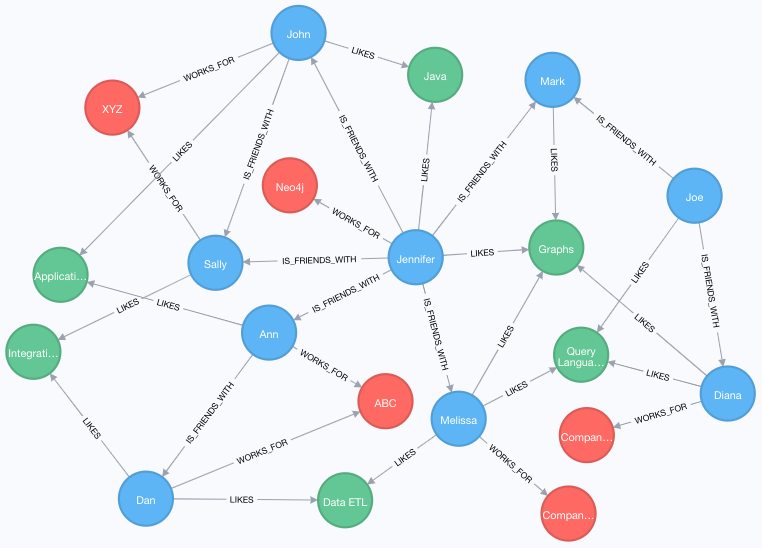
As you could imagine the relationship between Intricity and Alphabet might be much stronger through other Alphabet platforms. Graph databases have the ability to branch into many, many relationships at a time. Here are some attributed examples:
https://neo4j.com/developer/aggregation-returns-functions/
https://siliconangle.com/2018/09/20/neo4j-tunes-graph-engine-ai-applications/
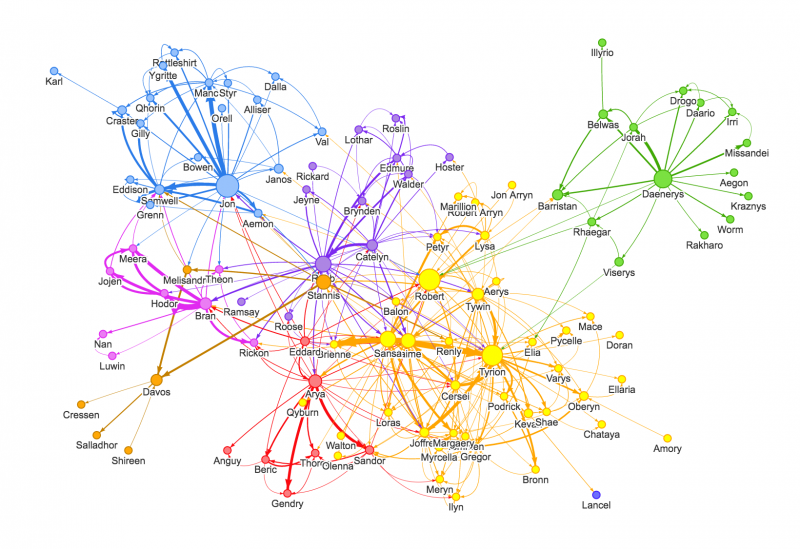
What surprises most people is that the graph database structure isn’t some kind of metaphorical representation of deeper tables. The graph database is the model you see. To see the raw data, here’s a CSV export from a movie data set provided from Neo4j.
 (https://neo4j.com/docs/labs/apoc/current/export/csv/#export-csv-file-export):
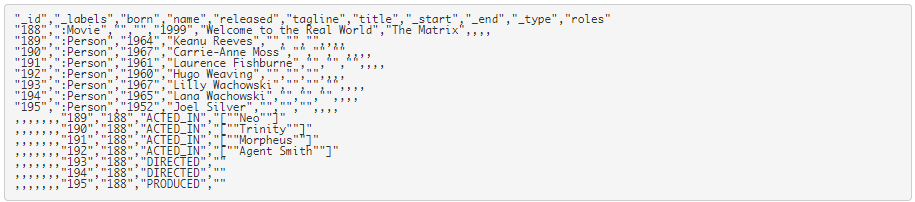
The goal here is to encapsulate the nouns and verbs in a model that can capture the connections between them. This simplicity allows the graph queries to traverse many joins.
Advantages
Performance
Unlike a relational database that works via set-based queries, a graph database already has the data stored in a “network” that “captures” the relationship within the data. For queries that need to determine the relationships/connections between “nodes”, the graph database performance is constant even as your data grows.
Purpose Built & Time to Market
For use cases that require a depth of understanding about a cohort of customers, vendors, locations, etc, where we would like to determine relationships, the distance between nodes [think LinkedIn or the famous example of degrees of separation with actor Kevin Bacon] we can deliver these solutions to market in more a streamlined and efficient way.
Disadvantages
Purpose Built
For use cases that have low cardinality such as application sources, On-Line Transaction Processing (OLTP), a graph database, would be used as a complementary solution. A graph database would not be appropriate for period-over-period reporting, capturing slowly changing dimensions, etc.
Skills
Unlike traditional databases (relational SQL based), graph databases have proprietary languages and APIs. These skills may not be as readily available in the marketplace.
Who is Intricity?
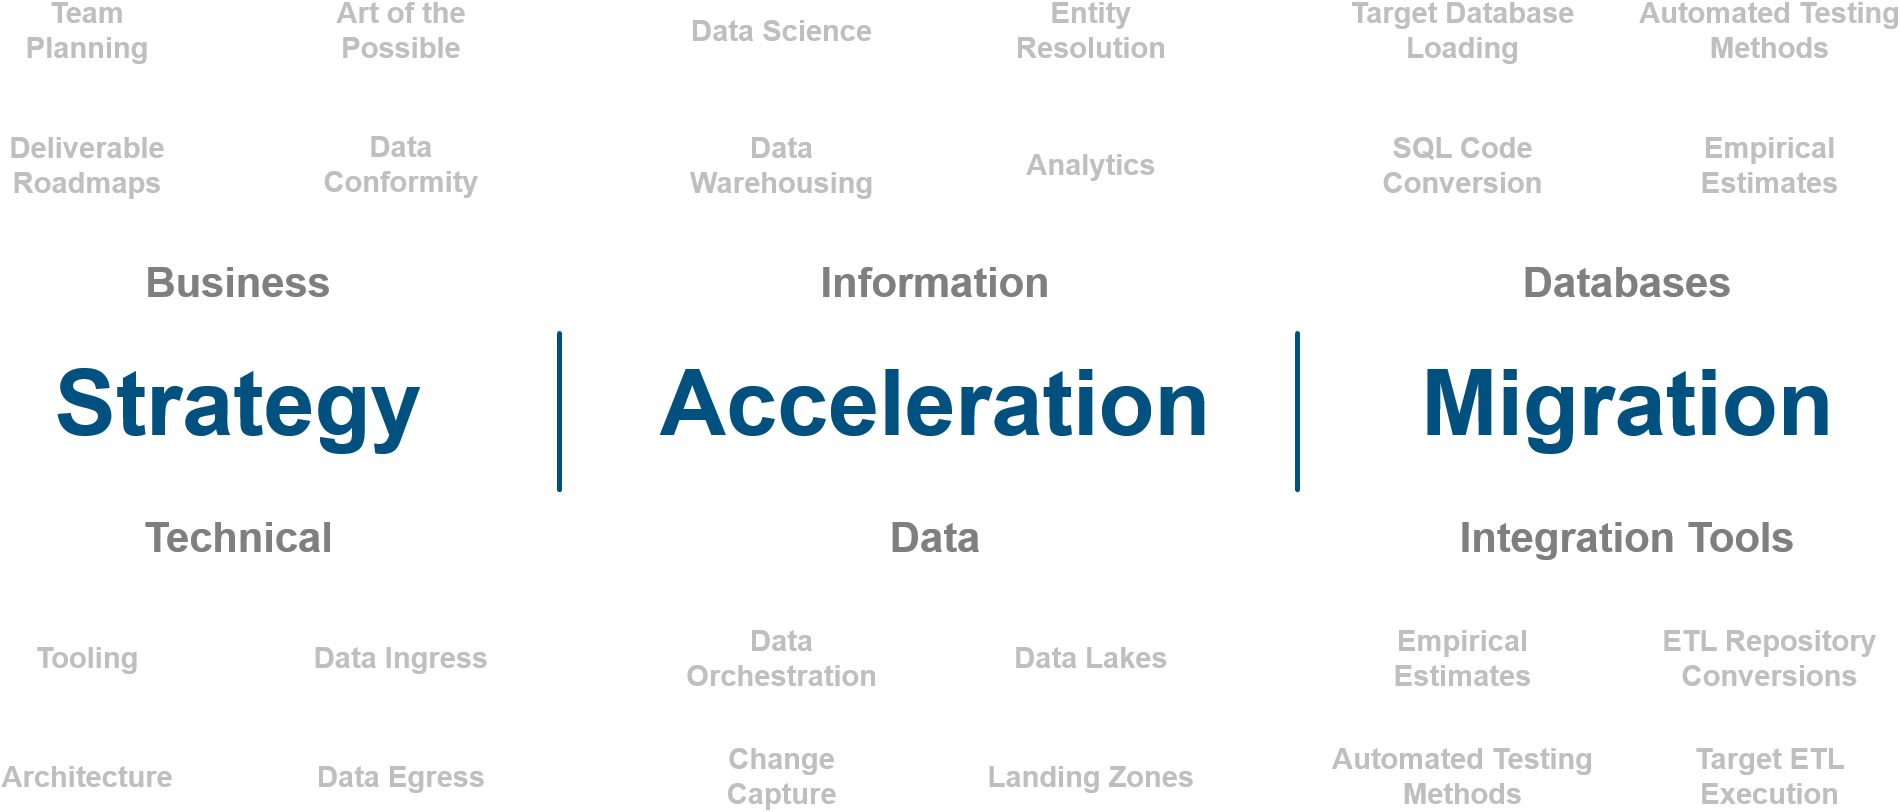
Intricity is a specialized selection of over 100 Data Management Professionals, with offices located across the USA and Headquarters in New York City. Our team of experts has implemented in a variety of Industries including, Healthcare, Insurance, Manufacturing, Financial Services, Media, Pharmaceutical, Retail, and others. Intricity is uniquely positioned as a partner to the business that deeply understands what makes the data tick. This joint knowledge and acumen has positioned Intricity to beat out its Big 4 competitors time and time again. Intricity’s area of expertise spans the entirety of the information lifecycle. This means when you’re problem involves data; Intricity will be a trusted partner. Intricity's services cover a broad range of data-to-information engineering needs:
What Makes Intricity Different?
While Intricity conducts highly intricate and complex data management projects, Intricity is first a foremost a Business User Centric consulting company. Our internal slogan is to Simplify Complexity. This means that we take complex data management challenges and not only make them understandable to the business but also make them easier to operate. Intricity does this through using tools and techniques that are familiar to business people but adapted for IT content.
Thought Leadership
Intricity authors a highly sought after Data Management Video Series targeted towards Business Stakeholders at https://www.intricity.com/videos. These videos are used in universities across the world. Here is a small set of universities leveraging Intricity’s videos as a teaching tool:

Talk With a Specialist
If you would like to talk with an Intricity Specialist about your particular scenario, don’t hesitate to reach out to us. You can write us an email: specialist@intricity.com
(C) 2023 by Intricity, LLC
This content is the sole property of Intricity LLC. No reproduction can be made without Intricity's explicit consent.
Intricity, LLC. 244 Fifth Avenue Suite 2026 New York, NY 10001
Phone: 212.461.1100 • Fax: 212.461.1110 • Website: www.intricity.com