Written by Jared Hillam
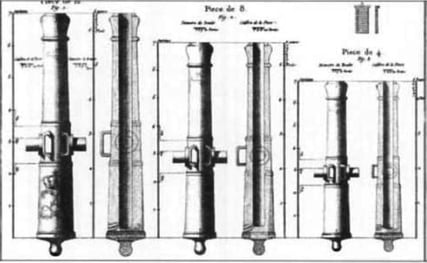
In the late-1700s there was an innovation which would change the world forever. This innovation came from the French Engineer & Lieutenant General Jean-Baptiste Gribeauval. He was charged with reforming the french military’s artillery. What he came up with was a standardized set of cannons and cannonballs. See up until that point cannons were not standardized, for each cannon, you made cannonballs to fit that specific cannon's barrel. Using Jean-Baptiste’s specifications, the French could freely produce cannon balls by simply staying within the designed tolerance. The concept of interchangeability was introduced to the world, and it became an integral part of the industrial revolution.

I share that story because it's a great illustration for something called coupling. But cannonballs are a crude simplification of coupling. Karl Weick, the one that came up with the coupling concept, wrote about more intangible systems like organizations and information systems. He discovered that tightly coupled systems run very smoothly when all the steps in that system are present and accounted for, but these types of systems are fragile to any change.  Like bumping one domino and having the rest of them fall.Understanding coupling comes in really handy when you’re setting up a system to turn data into information. Let me give you a few common examples of tightly coupled scenarios which we often see in this space.
1st Example- Dependence on Data Experts
 Tight Coupling
Let's say that you have your “data guy” that gives you all the information you need. Well this means that you are tightly coupled to that data guy. The day that analyst finds a new job is the day that you stop getting information. The more that “data guy” uniquely supplies and understands your organization's data, the more painful his or her exit is.
Loose Coupling
Loosening the dependence on an all knowing data guru is not easy. Business stakeholders don’t want to be mired in the mess of having to understand data. There are three things that can be done to avoid all the logic living inside somebody’s head.
Data Cataloging Tool
Data Cataloging tools provide a place which the organization can collaborate to identify data elements, describe them and reference them. Access to the data catalog becomes a must for people trying to grapple with how data works. The best ones see their role as a tool for the masses and don’t get mired in the weeds. Data Catalogs work best with the greatest level of human participation.
Data Warehousing
Data Warehouses do the hard work of aggregating and conforming the data from multiple sources so that business users can work with componentized and easily queryable data rather than raw transactions. This isn’t some kind of magic tool, Data Warehouses are developed after serious investment and focus from Business and IT stakeholders. The best Data Warehouses are treated like programs within an organization rather than treating them like a one-and-done project.
BI Metadata Layer
A BI Metadata layer provides a face to the data which the business stakeholders will see. So rather than seeing database table names, the business stakeholders will see actual business terms. There are multiple tools out there that claim to leverage a metadata layer. However the key here is how well the metadata layer works in conjunction with a Data Warehouse. Ideally the metadata layer is leaving the heavy lifting for processing the data to the Data Warehouse. Many analytics vendors take the approach of sucking in all the data to provide visualizations, but this ultimately just creates layers upon layers.
2nd Example- Customizing Applications
Tight Coupling
Your organization decides to custom build all the analytics into the CRM or ERP application. This means that you are tightly coupling yourself to your software vendor, because all your information assets are custom coded therein. So when you go to negotiate your fees with that vendor you no longer have the upper hand. Or worse, if you have to replace that vendor you now are forced to completely rebuild how your turn data into information.
Loose Coupling
Applications like CRMs and ERPs provide structure and automation to the processes you care most about. However, often organizations go too far in throwing every function into these applications, like the tight coupling example above. The deployment of applications needs to follow the COTS strategy. Every application should be deployed as Commercial Off The Shelf (COTS) as possible. This way organizations avoid a tight coupling to one vendor. But how is it possible to loosely couple the Analytics which are sourced from an application?
Reference a Separate Analytics Layer
Instead of customizing an application to visualize data, use frames in the application to reference a separate business intelligence layer’s analytics. These reference frames can usually be parameterized to provide the context that the application is in. This way the analytics are not dependent on the application front end.
Data Warehousing
To get you meaningful information, your organization will require the data to be conformed into components that the organization can use to assemble analytics. Otherwise every request for data is a fishing expedition.
A Data Warehouse allows for that conformity to occur separately from the application, and all the analytics are derived from that separate layer. So if we want to change the application I shouldn’t have to rebuild all my analytics, rather I just work on conforming the new applications data to the Data Warehouse. All the reports, analytics, dashboards, and whatever else is querying the Data Warehouse stay intact.
3rd Example- Nesting Logic
Tight Coupling
Your organization needs to change the way it calculates its costs. This will require you to change some logic in your analytics. However, since you already have thousands of reports and analytics we need to be sure that change is accounted for across all of them. There’s only one problem, the solution you choose for data visualization, nests the SQL query logic in the data visualization itself. Now you have to open each one individually, edit the SQL, and repeat… a thousand times. Because the visualization and the query logic are tightly coupled together.
Loose Coupling
I’ve written an entire white paper on this topic. When deploying a Business Intelligence tool you need to be thinking long term. Often organizations adopt a data visualization tool only to find that down the road they have 1000s of independent analytics floating around. This isn’t a problem if the tool you deployed is setup to support large bodies of content. However, if each piece of content is an island of SQL logic unto itself, then you have a problem. The moment that some query logic needs to be changed across multiple reports and analytics you have a lot of work to do. So how do you develop a lot of content without painting yourself into a corner?
BI Metadata Layer
A BI Metadata Layer is designed to decouple the individual reports and analytics from the actual query. This is done by centralizing the body of queries in a metadata model which points to the data but doesn’t store it. Additionally, it allows you to define logic for retrieving that data in one place. So if I need to change some logic I change it in one place and all the reports adopt it. When a query is made the BI Metadata Layer provisions the SQL automatically and the data is delivered to the visualization.
Data Warehousing
Hopefully you’re starting to see a trend on why a Data Warehouse is so important. The Data Warehouse provides the needed neutrality to justify your investment in conforming your data logic. (Data Warehousing isn’t cheap) What secures that investment is the fact that the Data Warehouse is a database, queryable by anything that can issue SQL. (thus any business intelligence tool)
Not only are the queries much simpler against a data warehouse, because all the attributes and measures have been conformed, but the queries run much faster as well. Additionally, a data warehouse conforms data from multiple data sources which turns what might be 400 lines of SQL logic down to less than 10.
4th Example- Compute & Storage
Tight Coupling
Each night you load data into a data warehouse to supply analytics to your business. However, on one particular night the load takes too long, so now it's running during the day, and users can’t even query the data warehouse because its compute power is tied up with loading data. So in this case the compute and the storage are tightly coupled together so you just have to wait until the data finishes loading for you to get access to the data again.
Loose Coupling
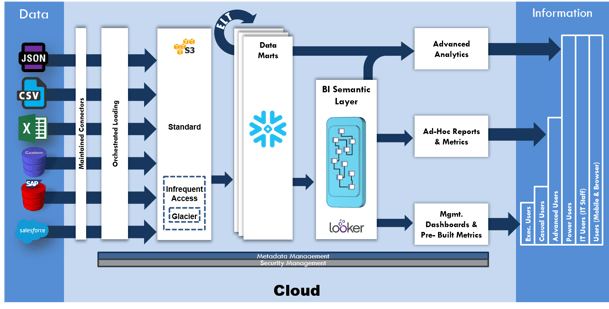
I don’t generally endorse vendors in my writings and videos. Rather I prefer to outline plusses and minuses of certain architectures. However, once in awhile an innovation comes along that is cornered by a single vendor. This doesn’t usually last long enough to make much of a splash but in the case of truly decoupling compute and storage, Snowflake Computing has a corner on this feature. Designed from the ground up, their database has the ability to leave data in a cheap storage cloud environment while conducting data processing using elastic compute resources. What this means is that compute resources related to analytics and compute resources related to processing new incoming data can be completely independent of each other. If you would like to investigate Snowflake further I’ve written a whitepaper on the topic titled What is Snowflake?

5th Example- Vendor Owned Data Warehouse
Tight Coupling
As a Marketing Professional you have got to get your hands on meaningful analytics to help you make some critical daily decisions. You either don’t have an IT department or you can’t rely on your IT department to be responsive enough to your analytic needs. Your organization decides to purchase an all-in-one solution that delivers a data warehouse and visualization offering in a turn key way. Now all your data logic and visualization are tightly coupled together and they are coupled to a single vendor. The moment you find another powerful analytics tool you’re stuck because your Data Warehouse is coupled to a single BI layer provided by that one vendor.
Loose Coupling
If you must use outside help to generate your analytics then I would recommend avoiding any distinct vendor locks. The entire investment in a Data Warehouse is justified by the fact that the Data Warehouse is a database, queryable by anything. The moment I say that this database is meant to service a single data visualization tool then I’ve compromised that investment’s justification.
A loosely coupled alternative is to leverage Intricity’s Information Factory as a Service offering. This is an open cloud architecture whose ownership is transferable at the end of the contract term. The components use the Data Warehousing and Business Intelligence best practices from years of experience in the Analytics space. The offering does provide a distinct BI tool but it offers an open door to query the environment outside the BI layer.
If you would like to learn about the Information Factory as a Service see here: http://www.intricity.com/information-factory-ifaas/
Planning Ahead

As you can see loose coupling provides a way to set up processes that can tolerate failures without impacting other processes. Rather than one domino’s fall impacting all of them, it just fails locally.
Setting up a loosely coupled data architecture takes raw experience. This is because tightly coupled architectures usually don’t reveal themselves early in the deployment process. Only through the experience of fixing failed deployments do you learn about these downsides. I recommend you reach out to Intricity to talk with one of our specialists about your specific situation. We can help you come up with a solution architecture that will outlast the whims and buzzwords of the market, and deliver value to your data to information needs.
Who is Intricity?
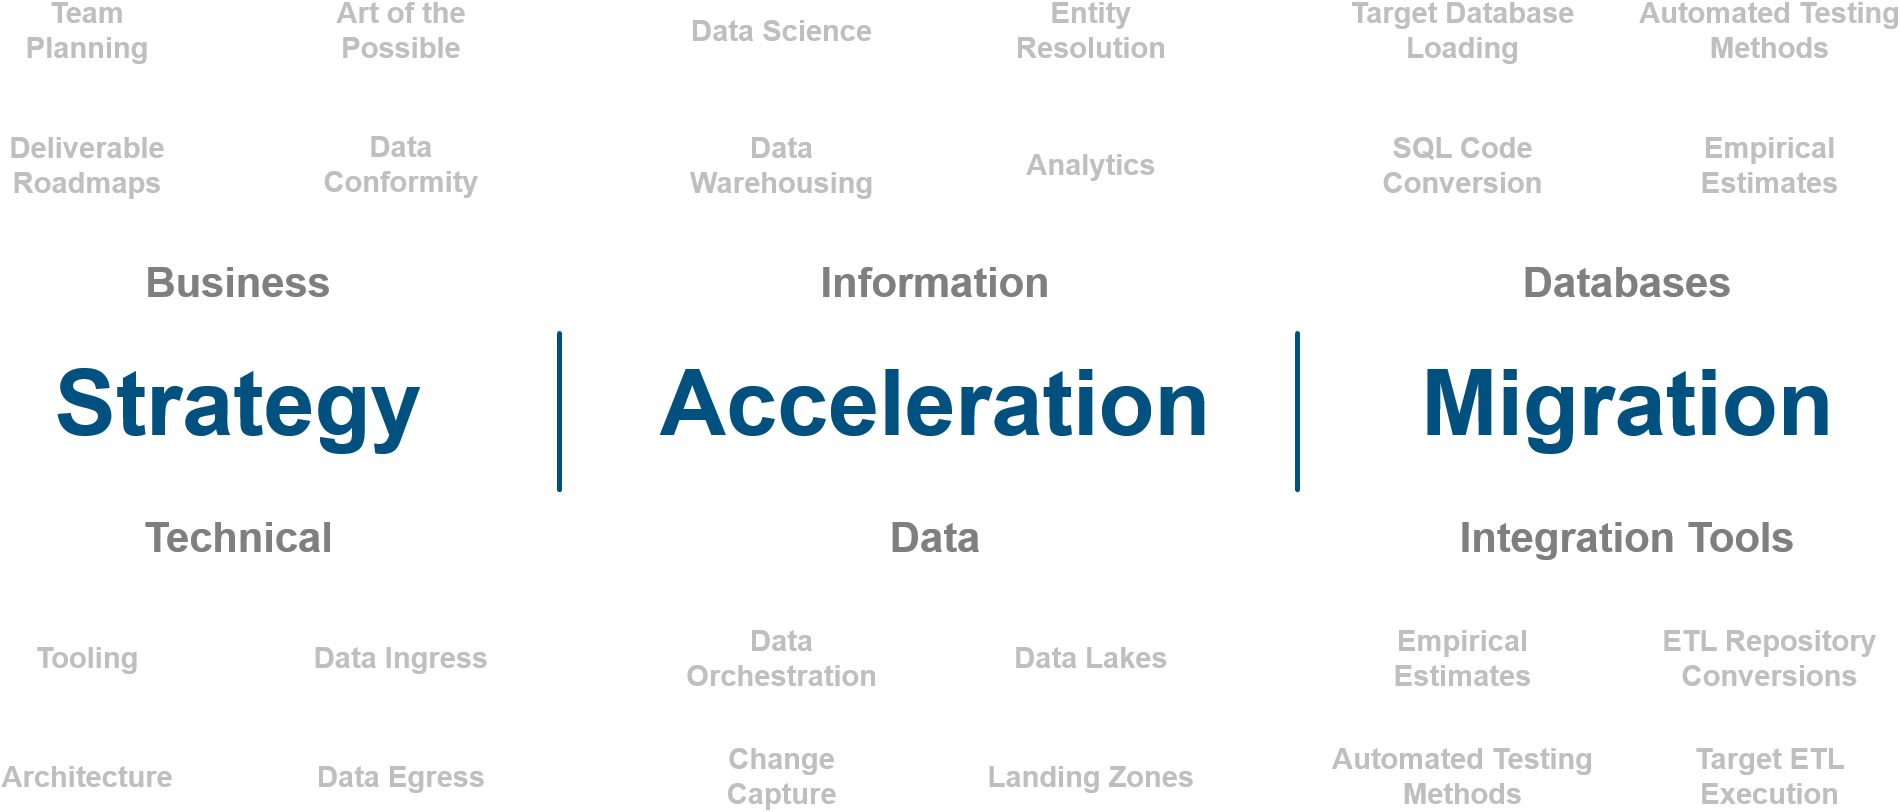
Intricity is a specialized selection of over 100 Data Management Professionals, with offices located across the USA and Headquarters in New York City. Our team of experts has implemented in a variety of Industries including, Healthcare, Insurance, Manufacturing, Financial Services, Media, Pharmaceutical, Retail, and others. Intricity is uniquely positioned as a partner to the business that deeply understands what makes the data tick. This joint knowledge and acumen has positioned Intricity to beat out its Big 4 competitors time and time again. Intricity’s area of expertise spans the entirety of the information lifecycle. This means when you’re problem involves data; Intricity will be a trusted partner. Intricity's services cover a broad range of data-to-information engineering needs:
What Makes Intricity Different?
While Intricity conducts highly intricate and complex data management projects, Intricity is first a foremost a Business User Centric consulting company. Our internal slogan is to Simplify Complexity. This means that we take complex data management challenges and not only make them understandable to the business but also make them easier to operate. Intricity does this through using tools and techniques that are familiar to business people but adapted for IT content.
Thought Leadership
Intricity authors a highly sought after Data Management Video Series targeted towards Business Stakeholders at https://www.intricity.com/videos. These videos are used in universities across the world. Here is a small set of universities leveraging Intricity’s videos as a teaching tool:

Talk With a Specialist
If you would like to talk with an Intricity Specialist about your particular scenario, don’t hesitate to reach out to us. You can write us an email: specialist@intricity.com
(C) 2023 by Intricity, LLC
This content is the sole property of Intricity LLC. No reproduction can be made without Intricity's explicit consent.
Intricity, LLC. 244 Fifth Avenue Suite 2026 New York, NY 10001
Phone: 212.461.1100 • Fax: 212.461.1110 • Website: www.intricity.com