For almost 2 decades I’ve struggled to draw an analogy to the data management space. However, data is its own animal, it has unique quirks like the ability to be copied perfectly. And you can move data at speeds that draw no parallel to things we can observe in the physical world. So there really aren’t great analogies that you can consistently draw from in order to help people justify their investments in it.
But a few months ago I was introduced to a recycled plastic processing facility which ended with the manufacturing of plastic pellets. Suddenly I felt like I might have a good analogy to data. It isn’t perfect, there are definitely holes, but it’s pretty good. So let's get started:
Every day a plastics recycling plant draws in truckloads of mixed recycled materials, these bulk deliveries are piled into a gigantic loading dock. You can think of this loading dock as a Data Lake. In a data lake, all the data is in one place, so you don’t have to go to the individual source of data each time you have a data request. But it's a pile of raw data. Now, to be honest, that recycling dock is a pretty smelly place, and it's chock full of stuff that isn’t plastic. So that entire pile of material has to go through an extensive and highly automated sorting and cleansing process, and this is true for the data lake as well.
So let's talk about both the cleansing and sorting process, starting with the cleansing side. If the plastic doesn’t get cleansed it will have impurities that will spoil the future objects made from that plastic. You can think of that future object as your analytics. If you have dirty data and you feed that data into your analytics, then those impurities in the data will mess with your aggregations, filters, charts, everything. So you have to be sure that your data has gone through the data cleansing process before it drives your analytics.
On the sorting side, the recycling plant has a significant set of automated conveyors that take the metal, paper, glass, organic material, and whatever else isn’t plastic so that the downstream processes are only dealing with plastic. As the plastic gets processed it gets turned into these pellets that look like sushi rice. These pellets ultimately have color differences which further get sorted with a very sophisticated optical sorting machine. So now I have all the reds together, all the greens together, all the whites together, etc.
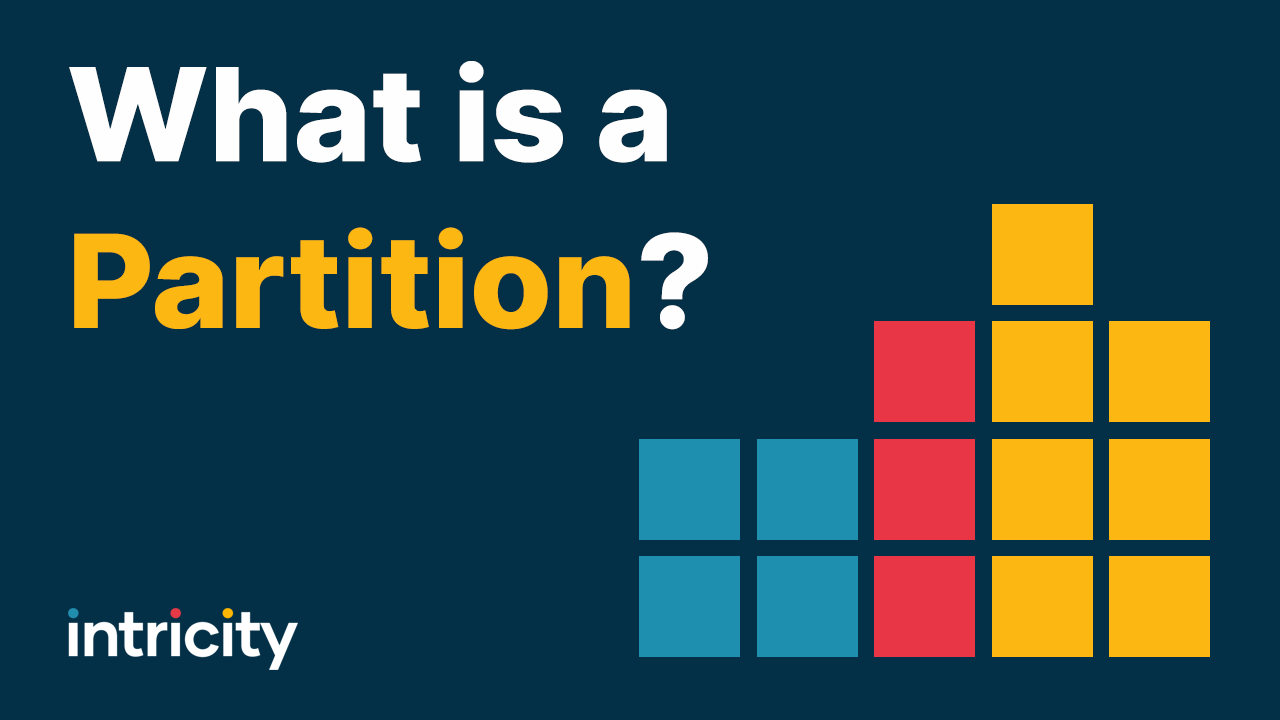
This extensive sorting process got me thinking about Master Data Management. Since companies have customer records scattered across dozens of data sources, they have to go through a disciplined sorting process to bring those customer records together, answering questions like,... Which customers are the same person? Which of the duplicate customer’s phone numbers is the right one to use? What date does “shipping date” really represent? All these things need to get resolved so we can get a consistent customer profile with our analytics downstream. Doing that in an automated fashion requires some seriously sophisticated software and process control. Just like the sophisticated sorting the recycling plant does.
Now, plastic pellets are a great starting point for manufacturing plastic objects, but for the average person, there’s not much we could do with plastic pellets. However, if we turned those plastic pellets into Lego bricks, I now can enable mass quantities of people to build things with the plastic. The same is true for application data, even if the application data is pristine and consistent across applications, we still have to conform that data into measures and attributes which can look across applications and be described consistently in one place. Otherwise, the average person won’t be able to interrogate the data. A Data Warehouse delivers this conformed data so users can easily combine the data like lego bricks and build analytics.
While the lego bricks are essential, I can speed up the lego assembly process if I have some instruction helping me build things. Now, this is a bit of a stretch, but imagine if you could have those lego instructions assemble components for you just by picking the components you liked. This is how a Business Intelligence Metadata Layer works with the data warehouse. It provides ready analytics components that have user-friendly names like Cost of Goods Sold, Customer Name, Product Name, Mailing Address, etc. When you pick one of those objects it updates the required query to retrieve and assemble the “lego bricks” of data that are necessary to get you that information.
I’ve had some fun building the “data as plastic” analogy. What’s really fun about it though is that I can attribute it to so many facets of the data management space. I’m not going to dive into those facets in this video, but the process that I’ve described is how you go about scalably manufacturing data into information. The machinery required to do this in your organization is something Intricity can help you map out. Each company is going to have different nuances on how to set this process up. I’ve put together a short engagement synopsis to describe what exactly we do. If you would like to take a look at this synopsis click here And of course you can reach out to Intricity at any time to speak with a specialist.